Deutsche Bahn (DB) - Controlled experiment at Userlane
Project summary
Userlane is an interactive navigation system for software, created primarily for enterprise customers. In order to investigate the impact on employee productivity when using Userlane the company executed a controlled experiment with Deuche Bahn (DB). The experiment involved 100DB employees recruited in cooperation with internal DB partner.
My contribution
I have taken over the experiment after it was designed and first participants were recruited. Therefore, I could not adjust the experiment design. Despite that, I used the data to not only to investigate the given hypothesis, but also to evaluate the usability of Userlane. That way I have maximized the outcome of the experiment conducted with one of the Userlane’s top customers and identified the areas for improving the product and next studies.
What
Controlled experiment (split test) with 100 DB employees. 50 DB employees were asked to perform 3 JIRA tasks with Userlane and 50 DB employees performed the task without the Userlane.
Hypothesis
H1. The task completion in JIRA is higher when using Userlane than when using other available resources including the internet.
Experiment process
Participants recruitment was executed by Userlane’s internal contact at DB. All participants performed the tasks during the working hours on their work computers and the findings were recorded using Smartlook.
Analysis process
In order to analyze the findings, I created the template where I recorded the User ID, Activities (number of completed fields within a JIRA form belonging to each task), completion status (completed, not completed).
The results
All in all, the results of the experiment indicated the following:
The completion rate of the 1st task was better without the Userlane: 95% success without Userlane vs 76% completion rate with Userlane.
The completion rate of test 2 was better with Userlane: 48% success without Userlane and 90% with.
When it comes to the activities registered in JIRA forms, users performed better without Userlane. The user preformed on average 2.8 activities their own vs 2.4 with Userlane.
Maximizing the results
The results of the experiment indicated that participants using Userlane had lower overall task completion compared to the other participants. It could result from the fact that the company did not specify the digital literacy of the participants or their prior experience with the JIRA test task before recruiting participants. That would make the validity gathered data questionable.
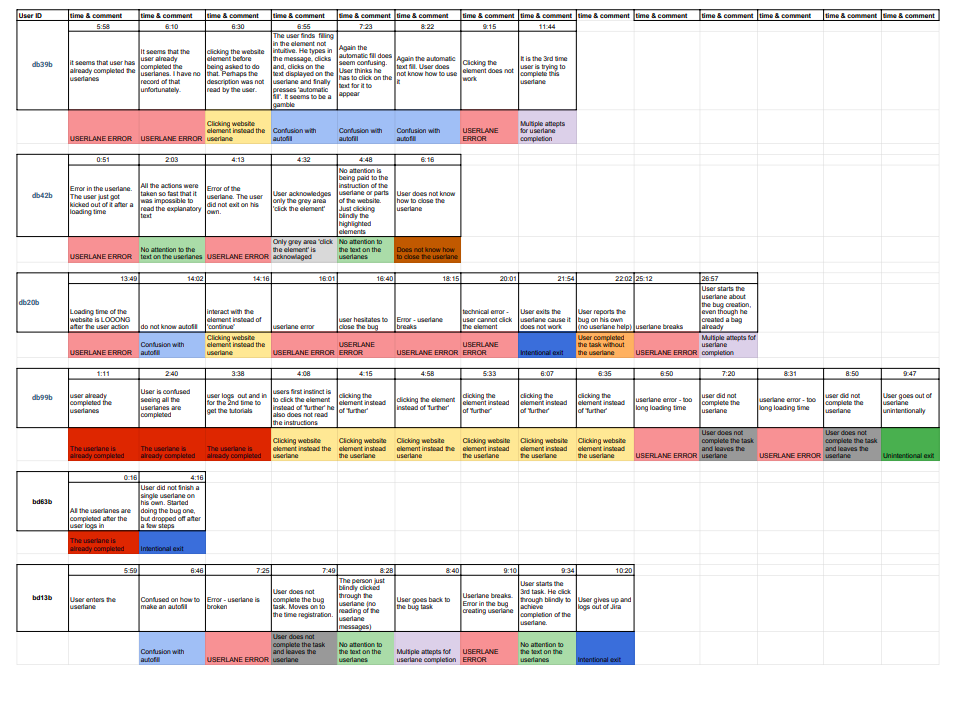
In order to understand what prevented the users using Userlane to perform well I have identified the occurred usability errors. I used the emergent coding method. I logged in the data from the videos and developed a coding scheme using an Excel spreadsheet. Next, I color coded similar actions in order to get an overview of a variety of error types and have a solid ground to move into the next coding phase. After all videos were reviewed, I consolidated the codes and merged them into higher-level categories. It resulted in 11 main categories, which were explained in the coding manual. Both the categories and the descriptions can be seen in the table below.
Findings
The findings of the usability test are the following:
In 83% of the cases, the Userlanes had errors.
In 50% of the tests, the user did not acknowledge that they should click 'next' on the Userlane. They were trying to click the page element.
In 50% of the tests, users were confused with the autofill option. They were clicking the text as well as typing it themselves without a step completion.
In 50% of the tests, users had multiple attempts on completing the Userlane. Mostly because their Userlane broke during the test.
In 20% of cases, users just rushed through the Userlane. They have not paid attention to the explanatory text.
In 50% of the tests, users had multiple attempts on completing the Userlane. Mostly because their Userlane broke during the test.
33% of the users did not complete the Userlane and left.
Video minutes coding & data consolidation
In the table below one can see an example of recordings being coded. Each column starts with a unique user ID which is followed by recorded usability errors. Those are characterized by the time of occurrence and short description. Below each usability error there is a color coded usability error type. In order to later consolidate the data I have placed all the top level categories in the top row of the file and marked the number of error occurrence through the videos.
Next steps
As for the further steps, I advised the design of a new experiment. With a strong focus on study design and pilot study. The reason for that is the fact that most usability issues resulted from the Userlane error. That can be prevented by executing a pilot study in order to ensure that the participants will not encounter errors.
Looking at the Usability findings, it is a great starting point for the design of the next usability test. The results highlight the focus areas which should be investigated in the future. Those are:
click element feature
text input feature.

